Temperature Changes in Urban Asia: The Cases of Singapore, Hong Kong, and Seoul
By Yoonhee Jung
The world’s temperature is increasing globally. Human-induced warming raised the temperature of the earth approximately 1°C (likely between 0.65°C and 1.06°C) between 1880 and 2012 (Figure 1).1Global warming is defined in the report of the Intergovernmental Panel on Climate Change (IPCC) as an increase in combined surface air and sea temperatures averaged over the globe.And this trend is accelerating. The last three decades was likely the warmest 30-year period of the last 800 years in the Northern Hemisphere, where such assessment is possible. The total increase between the average of the 1850–1900 period and the 2003–2012 period is 0.78°C, based on the single longest dataset available2.
While most land regions have experienced greater warming than most oceans, and many regions have experienced warming greater than the global average, it is obvious that the globe is getting warmer and the speed of this change is increasing.
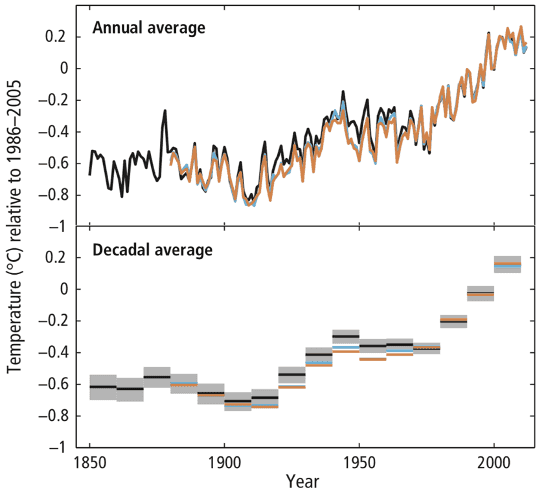
Figure 1: Observed globally averaged combined land and ocean surface temperature anomaly 1850-2012. Source: IPCC Fifth Assessment Report in 2013.
According to IPCC’s fifth assessment report (2013), particularly large warming trends in the 20th century occurred in northern Asia. This map shows the relative increase in temperature (not the absolute temperature) between 1901 and 2012. The warming trend was particularly strong in the cold season between November and March, with an increase of 2.4°C around the mid-latitude semiarid area of Asia.


Figure 2. Temperature Change Trend over 1901-2012 (°C)
Singapore’s mean surface air temperature record has shown a similar pattern to the global trend since 1948 (Figure 3).3An average rise of 0.25°C per decade occurred after 1948. The upward temperature trend found in Singapore is significantly steeper than that of the globe as a whole.
It is proven that anthropogenic (human induced) increase in greenhouse gas concentrations has been the major cause of observed global warming. Many scholars (e.g. Roth and Chow, 2007) have attributed the rising temperatures in Singapore to a combination of global warming and the Urban Heat Island effect-caused by the extra heat generated from urban activities and trapped by urban surfaces such as buildings and roads.4
Noting the sharp temperature increase since the 1970s, a strong factor in addition to global warming was almost certainly rapid urban development, and the resulting creation of an Urban Heat Island.
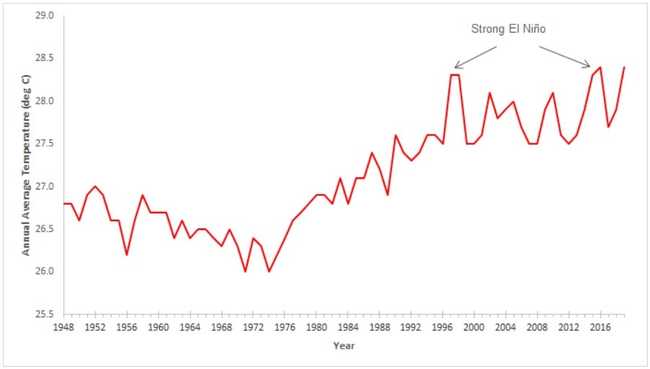
Figure 3: Annual mean temperature in Singapore from 1948 to 2019 (data based on climate station).
Data from the weather station at Changi and collected in successive Mays (one of the hottest months in Singapore), shows eight of the ten warmest years on record in Singapore have occurred in the 2000s and 2010s. All ten of the warmest years post-date 1997 (Table 1).
Table 1: Top ten temperature record at Changi
| Year | Annual Average Temperature in Degree Celsius |
|---|---|
| 1998 | 29.394 |
| 1997 | 29.355 |
| 2016 | 29.287 |
| 2019 | 29.261 |
| 2010 | 29.235 |
| 2003 | 29.197 |
| 2004 | 28.939 |
| 2020 | 28.913 |
| 2002 | 28.877 |
| 2008 | 28.771 |
Source: Meteorological Service Singapore.
At the Hong Kong Observatory, temperature readings have been available since 1885, except for a break during World War II from 1940 to 1946. Analysis of the annual mean temperature data there showed an average rise of 0.13°C per decade from 1885 to 2019. The rate of increase in average temperature accelerated in the latter half of the 20th century, increasing at an average rate or 0.21°C per decade during 1990-2019.5
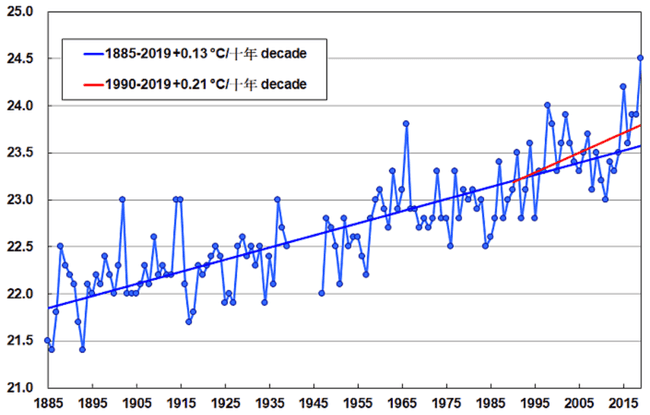
Figure 4: Annual mean temperature in Hong Kong from 1885 to 2019. Source: Hong Kong Observatory.
In Seoul, the mean average temperatures of summers since 1950 have spiked as well (Figure 5). The temperature increase trend in Seoul, averaging 0.3°C per decade, is even higher than the trend in Singapore (0.25°C per decade).6
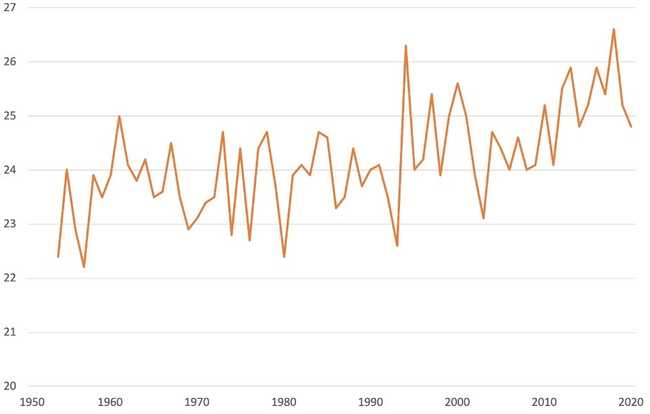
Figure 5: Annual summer mean temperature in Seoul from 1950 to 2020. Source: Korea Meteorological Administration.
As seen from the cases of Singapore, Hong Kong, and Seoul, warming rates in Asian cities since the 20th century have surpassed the global trend. It is noteworthy that the warming trends in all the three Asian cities accelerated in the second half of the 20th century, a period in which the region experienced its most rapid urbanization and development.
- Intergovernmental Panel on Climate Change Fifth Assessment Report in 2013↩
- ibid.↩
- Meteorological Service Singapore (http://www.weather.gov.sg/home)↩
- Roth, M., & Chow, W. T. (2012). A historical review and assessment of urban heat island research in Singapore. Singapore Journal of Tropical Geography, 33(3), 381-397.↩
- Hong Kong Observatory (https://www.hko.gov.hk/en/climate_change/obs_hk_temp.htm)↩
- Korea Meteorological Administration (https://data.kma.go.kr/cmmn/main.do)↩
