5 June 2025
How to Tell a Better Story With Data
At a recent NUS masterclass, industry professionals and alumni shared practical tips, tools and personal lessons on using data to craft impactful, real-world narratives. Here's what the participants learned.

The session attracted a full crowd at Shaw Foundation Alumni House.
In today’s data-saturated world, dashboards and numbers alone rarely drive action. “Data is essential, but stories are really how people understand, care and act,” said Dr Subhayan Mukerjee, Assistant Professor at NUS’ Department of Communications and New Media, who led the recent masterclass on 26 May at the Shaw Foundation Alumni House.
Dr Subhayan shared a three-step framework to guide effective data storytelling:
- Find the signal: Extract one clear insight from the noise.
- Build the narrative: Frame that insight using a story arc (problem, insight, resolution).
- Show and tell: Use visuals and annotations to guide interpretation.
He illustrated this with examples like Spotify Wrapped, which transforms listening data into personalised narratives that users eagerly share on their social media. Another example was The Straits Times interactive feature on athlete Shanti Pereira, which turned race statistics into a compelling story of perseverance and performance.
 Dr Subhayan Mukerjee
THE CHALLENGE OF TOO MUCH DATA
During the panel discussion, Ms Ambika Srinivasa (Arts & Social Sciences ’22, MOC ’24), Account Executive at Bud Communications, said the hardest part of her job in tech PR is cutting through the clutter. “You are constantly flooded by a plethora of sources,” she shared. “It’s really an exercise in discernment and research to find a statistic that is credible, recent and relevant.” She recommended going straight to trusted industry sources like WARC, Campaign Asia, or reports backed by IMDA. These, she says, lend credibility both to the story and to the client.
BALANCING STAKEHOLDER EXPECTATIONS
Data storytelling often involves navigating multiple stakeholders, each with different priorities. Mr Darrell Lian (Arts & Social Sciences ’15), Business Manager at Kontinentalist, explained how this plays out in his work with UOB and NGOs. Kontinentalist is a Singapore-based data storytelling studio that crafts visually compelling narratives about Asia, bridging the gap between research and the public through creative storytelling and data visualisation. “The issue isn’t a shortage of data—it’s about choosing the right story for your audience,” he explained. In one case, Mr Lian recalled having to choose whether to highlight fintech investment trends by country or by product category. “We always go back to: who are we trying to reach?” Ms Ambika added, “The more you can do with a data point, the more valuable it becomes. It needs to lead somewhere—a call to action, a resolution or a real-world benefit.”
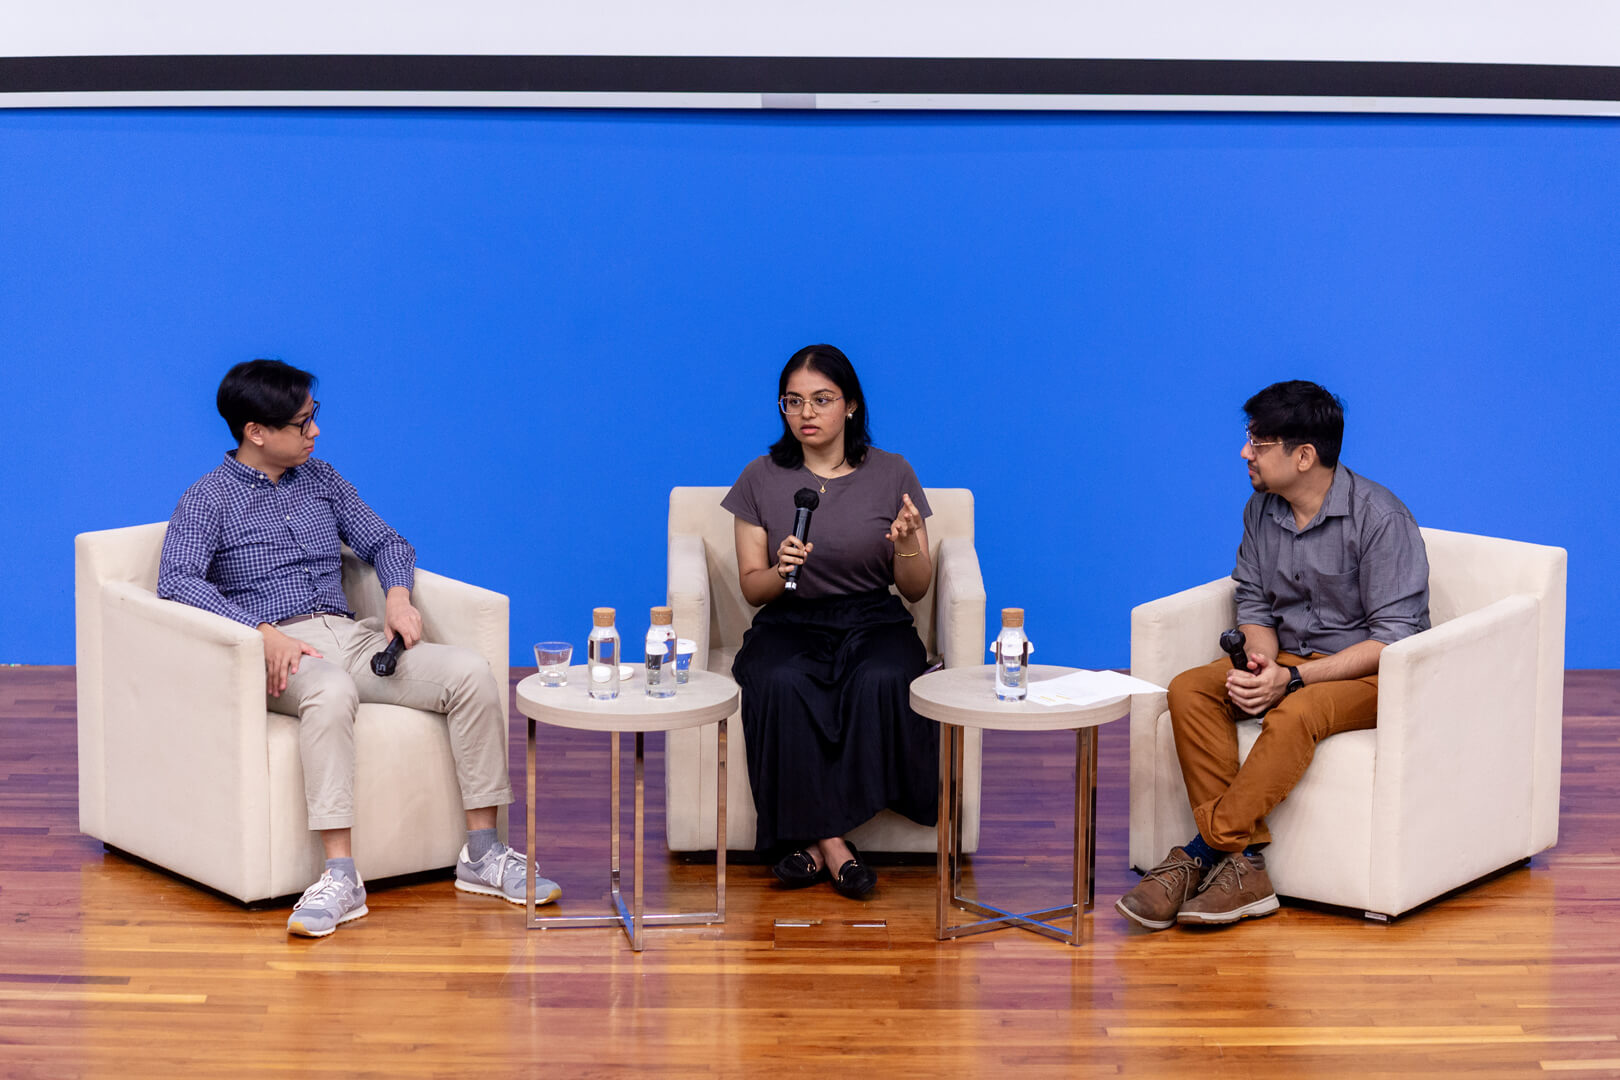 Ms Ambika Srinivasa (Arts & Social Sciences ’22, MOC ’24), centre, addresses the challenge of too much data.
TOOLS AND TECHNIQUES THAT WORK
Both speakers also shared the tools they use to bring data stories to life.
- Meltwater: Ms Ambika uses it to track article views, sentiment analysis and keyword performance. It helps her report campaign effectiveness in terms that matter to clients.
- Flourish: Mr Lian recommends this free, web-based tool for creating interactive and visually striking charts. “It’s great for getting started and works well with Excel or Google Sheets.”
- Google Analytics: A beginner-friendly tool to understand web traffic and user engagement.
The general consensus among the speakers is that you don’t need fancy tools to begin. Start with what you know, like Excel or Google Sheets, and build from there.
 Mr Darrell Lian (Arts & Social Sciences ’15)
USING AI: HELPFUL BUT HANDLE WITH CARE
AI is becoming a common aid in data storytelling, but both speakers stressed that it is no replacement for human judgment. Both Mr Lian and Ms Ambika agreed that while AI can speed up research and ideation, every output must be fact-checked. “AI helps us create mock-ups or early drafts quickly, but it’s far from perfect,” said Mr Lian. “You won’t get highly customised or high-quality results from just prompting a tool.” Ms Ambika shared a cautionary tale: “ChatGPT once gave me a stat that wasn’t in the original client’s report. It just made it up. That really scared me.”
HOW TO START DATA STORYTELLING AS A BEGINNER
Whether you're in PR, business analytics or public policy, the general principles around data storytelling are the same: start with the insight, shape a story around it and present it in a way
your audience can relate to. And always remember, as Dr Subhayan put it: “If you can’t say it in one sentence, you haven’t really found the story.”
When Dr Subhayan asked the speakers to suggest how people can approach data storytelling as a novice, Mr Lian’s advice to newcomers is this: “Before you get to the story, get comfortable with data.” His suggestion is to take a simple dataset, like a spreadsheet with two columns, and explore it. “Try to visualise it, look for trends and ask yourself what stands out,” said Mr Lian.
Ms Ambika added, “You don’t even need a tool to start—just awareness. Pay attention to how numbers are being used in daily media, even Instagram posts. That mindset shift is the first step to telling your own data story.”
WHAT THE AUDIENCE ASKED
The panel ended with a lively Q&A. Here are a few highlights:
- On Black Swan events: One participant asked how to use data storytelling to uncover unknown risks. Dr Mukerjee noted, “If you don’t know what you don’t know, it’s hard to frame a story.” Ms Ambika said that, in such cases, preparing a Q&A and engaging in a discovery session with consultants could help.
- When asked how we can benchmark data and ensure the credibility of information—especially from social media and news websites—Mr Lian advised looking for cited sources and transparent methodologies, while Ms Ambika added that data from government-backed or accredited bodies helps ensure credibility.
- Driving Real-World Impact: When asked if they had worked on a data storytelling project that successfully influenced stakeholder behaviour, Mr Lian shared a campaign he worked on that helped reduce monkey feeding incidents in Singapore — demonstrating how thoughtful data storytelling can drive real-world impact.

Text by Audrina Gan. Photos by Roy Yap.